Preparing figures
- Liz

- Dec 6, 2025
- 3 min read
Updated: Jun 13
Key points: ● Have the text in your figures proofread before converting them into an image. ● Remember to translate the text in your figures if you have created them using your first language. ● Check whether you need to use points or commas as decimal separators in your data points. ● Take care when copying or re-sizing your images.
Figure preparation is not always within your control, especially when you are working with co-authors! It’s also easy to overlook your data presentation when you’re focusing on writing up your results.
Proofreading the text
If you convert your figures into images and these figures contain errors in the English, most spell-checkers won’t be able to identify them. Although a good proofreader will highlight mistakes, they will not be able to correct them, and you will have to re-do the figure based on the proofreader’s feedback. Correcting mistakes like this is a simple enough process but it does cost time and generate stress, especially if your submission date is looming!
If possible, have your figure components proofread before you convert the figure into an image.
Using your first language
The above also applies if you have created your figures using a different language from the body of the text. For example, researchers will often run statistical software packages in their first language and then import those results into the final document.
So, if you have created your figures using text written in your first language, remember to translate this before submitting the document for review by a proofreader, journal or supervisor. If you have converted these figures into images, most spell-checkers won’t pick up language issues.
Using commas or points (or dots) as decimal separators
In most countries in Europe, and many in the rest of the world, the convention is to use a comma (,) as a decimal separator (e.g. 2,5 kg). As always, the UK has to be different! The UK and US and others use points (or dots) as their decimal separator (e.g. 2.5 kg).
It's worth checking your figures to see if you have commas as decimal separators (see the mocked-up example below) when reporting your results and whether you need to change these to points to suit the journal or university format.

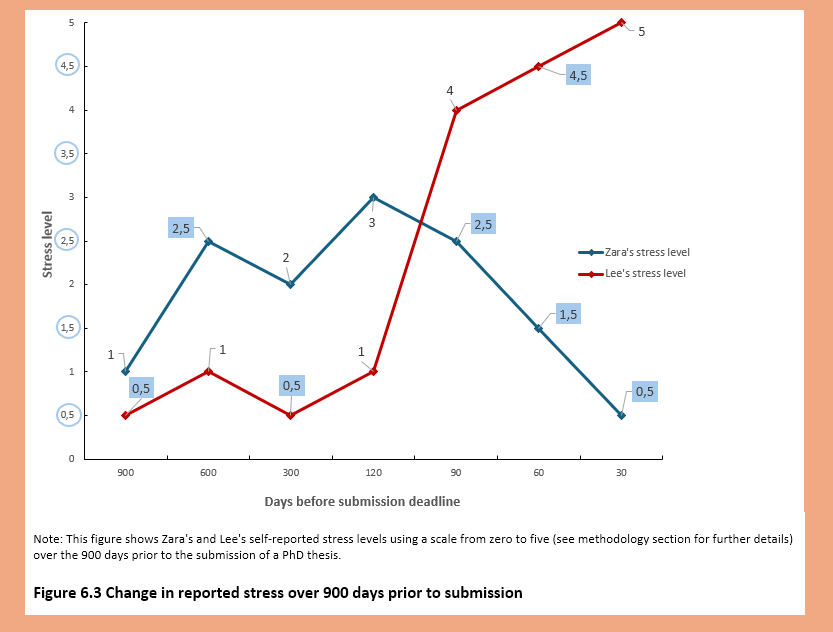
If your software allows, change the commas if you need to and, if possible, do this before you convert your figure into an image.
Distortion and blurring of images
If you copy or create an image and then paste it into your document, and especially if you re-size it, check that the image is sharp and that it hasn’t become distorted.
One common reason for images to become distorted is a failure to lock the aspect ratio. In the images of globes below, the first is the original and the second is an example of one that has been re-sized. This might look exaggerated but I have seen very well-written documents with maps so distorted that the country is unrecognizable.


Blurring is also a potential problem, especially for figures that have been converted into images. You have already seen this decimal separators figure but here it is blurred, difficult to read and would almost certainly be rejected by a journal.

If you can, it’s worth bearing the above points in mind, as you could save yourself time and effort in the long run.